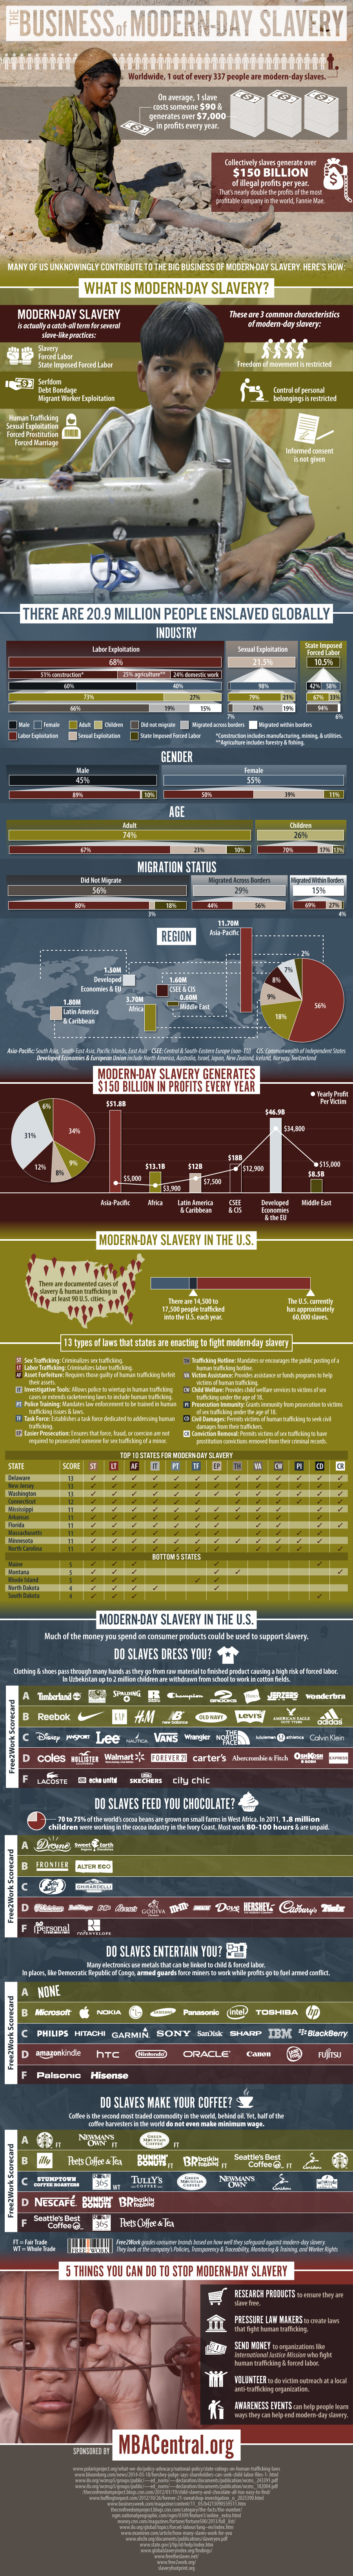
The Business of Modern-Day Slavery
Worldwide, 1 out of every 337 people are modern-day slaves. On average, that 1 slave cost somebody $90 but generates over $7,000 in profits every year. Collectively slaves generate over $150 billion of illegal profits per year. That’s nearly double the profits of the most profitable company in the world, Fannie Mae, which pulled in $84 billion of profits in 2013. The harsh reality is that many of us unknowingly contribute to the big business of modern-day slavery. Here’s how:
What is Modern-Day Slavery?
These are 3 common characteristics of modern-day slavery:
- The victim’s freedom of movement is restricted
- The victim’s control of personal belongings is restricted
- The victim’s fully informed consent is not given
“Modern-Day Slavery” is actually a catch-all term for several slave-like practices:
- Slavery: When a person is treated like a piece of property that can be bought, sold, traded, or even destroyed.
- Forced Labor: When a person is forced to work, without their consent, by threats or coercion. This includes bonded labor, forced domestic work, forced labor of migrants, forced begging, and work imposed in the context of slavery or vestiges of slavery.
- State Imposed Forced Labor: When work is demanded by public authorities, military, or paramilitary.
- Exceptions:
- work of a purely military character
- “normal” civic obligations
- work as a consequence of a conviction in a court of law and carried out under the control of a public authority
- work in emergency situations such as wars or natural calamities
- minor communal services
- Prohibitions:
- as a means of political coercion or education
- as punishment for expressing political views or for participating in strike action
- as labor discipline
- as racial, social, national, or religious discrimination
- as mobilization for economic development
- Exceptions:
- Serfdom: When a person is required to live on land belonging to the person they work for and is not free to leave.
- Debt Bondage: When a person is required to give services as security for a debt; however, the length and nature of the services are not defined nor are they applied to liquidate the debt.
- Migrant Worker Exploitation: This involves confiscating workers’ passports or documents, withholding wages, extremely low wages, debt bondage, violence, and prostitution.
- Human Trafficking: When a person is recruited or transported by the means of force or coercion for the purpose of sexual or labor exploitation.
- Sexual Exploitation: Any commercial sexual activity, including pornography, demanded from the victim by fraud or force.
- Forced Prostitution: When a person is forced or coerced to engage in sexual acts in return for a payment, regardless if someone other than the victim receives the payment or not.
- Forced Marriage:
- When a woman is given in marriage without the right to refuse
- When a woman’s husband, family, or clan transfers her to another person
- When a husband dies and his widow becomes the wife of another family member
There are 20.9 million people enslaved globally
These numbers are from the U.N. International Labor Organization in 2012 and include forced labor and human trafficking but does not include other types of slavery like forced marriage.
A 2013 publication, the Walk Free Global Slavery Index, uses a more expansive definition of slavery and puts the figure at 29.8 million worldwide.
Industry
- 14.2 million (68%) are enslaved through labor exploitation
- 7.2 million (34.5%)(or 51% of labor exploitation) are in construction*
- 3.55 million (17%)(or 25% of labor exploitation) are in agriculture*
- 3.45 million 16.5%)(or 24% of labor exploitation) are in domestic work
- 4.5 million (21.5%) are enslaved through sexual exploitation
- 2.2 million (10.5%) are enslaved through state imposed forced labor
- Within labor exploitation
- 60% are male / 40% are female
- 73% are adults / 27% are children
- 19% migrated across borders / 15% migrated within borders / 66% did not migrate
- Within sexual exploitation
- 2% are male / 98% are female
- 79% are adults / 21% are children
- 74% migrated across borders / 19% migrated within borders / 7% did not migrate
- Within state imposed forced labor
- 42% are male / 58% are female
- 67% are adults / 33% are children
- 0% migrated across borders / 6% migrated within borders / 94% did not migrate
Gender
- 9.5 million (45%) are male
- 8.52 million (89%) are in labor exploitation
- 0.09 million (1%) are in sexual exploitation
- 0.92 million (10%) are in state imposed forced labor
- 11.4 million (55%) are female
- 5.68 million (50%) are in labor exploitation
- 4.41 million (39%) are in sexual exploitation
- 1.28 million (11%) are in state imposed forced labor
Age
- 15.4 million (74%) are adults
- 10.37 million (67%) are in labor exploitation
- 3.56 million (23%) are in sexual exploitation
- 1.47 million (10%) are in state imposed forced labor
- 5.5 million (26%) are children
- 3.83 million (70%) are in labor exploitation
- 0.95 million (17%) are in sexual exploitation
- 0.73 million (13%) are in state imposed forced labor
Migration Status
- 6.06 million (29%) migrated across borders
- 2.63 million (44%) are in labor exploitation
- 3.33 million (56%) are in sexual exploitation
- 0.00 million (0%) are in state imposed forced labor
- 3.14 million (15%) migrated within borders
- 2.16 million (69%) are in labor exploitation
- 0.86 million (27%) are in sexual exploitation
- 0.13 million (4%) are in state imposed forced labor
- 11.70 million (56%) did not migrate
- 9.41 million (80%) are in labor exploitation
- 0.32 million (3%) are in sexual exploitation
- 2.07 million (18%) are in state imposed forced labor
Region
- 11.70 million (56%) are in Asia-Pacific
- Prevalence: 1 out of every 303 people are enslaved (or 33 people are enslaved for every 10,000 people)
- 7.91 million (68%) are in labor exploitation
- 4.97 million (43%)(or 63% of labor exploitation) are in construction*
- 1.04 million (9%)(or 13% of labor exploitation) are in agriculture*
- 1.90 million (16%)(or 24% of labor exploitation) are in domestic work
- 2.50 million (22%) are in sexual exploitation
- 1.20 million (10%) are in state imposed forced labor
- 3.70 million (18%) are in Africa
- Prevalence: 1 out of every 250 people are enslaved (or 40 people are enslaved for every 10,000 people)
- 2.54 million (68%) are in labor exploitation
- 0.84 million (22%)(or 33% of labor exploitation) are in construction*
- 1.13 million (30%)(or 45% of labor exploitation) are in agriculture*
- 0.57 million (15%)(or 22% of labor exploitation) are in domestic work
- 0.80 million (21%) are in sexual exploitation
- 0.40 million (11%) are in state imposed forced labor
- 1.80 million (9%) are in Latin America and the Caribbean
- Prevalence: 1 out of every 323 people are enslaved (or 31 people are enslaved for every 10,000 people)
- 1.20 million (67%) are in labor exploitation
- 0.19 million (11%)(or 16% of labor exploitation) are in construction*
- 0.36 million (20%)(or 30% of labor exploitation) are in agriculture*
- 0.65 million (36%)(or 54% of labor exploitation) are in domestic work
- 0.40 million (22%) are in sexual exploitation
- 0.20 million (11%) are in state imposed forced labor
- 1.60 million (8%) are in CSEE & CIS
- Prevalence: 1 out of every 238 people are enslaved (or 42 people are enslaved for every 10,000 people)
- 1.05 million (68%) are in labor exploitation
- 0.55 million (35%)(or 52% of labor exploitation) are in construction*
- 0.47 million (30%)(or 45% of labor exploitation) are in agriculture*
- 0.03 million (2%)(or 3% of labor exploitation) are in domestic work
- 0.30 million (19%) are in sexual exploitation
- 0.20 million (13%) are in state imposed forced labor
- 1.50 million (7%) are in Developed Economies & EU
- Prevalence: 1 out of every 667 people are enslaved (or 15 people are enslaved for every 10,000 people)
- 1.02 million (67%) are in labor exploitation
- 0.46 million (30%)(or 45% of labor exploitation) are in construction*
- 0.53 million (35%)(or 52% of labor exploitation) are in agriculture*
- 0.03 million (2%)(or 3% of labor exploitation) are in domestic work
- 0.30 million (20%) are in sexual exploitation
- 0.20 million (13%) are in state imposed forced labor
- 0.60 million (3%) are in Middle East
- Prevalence: 1 out of every 294 people are enslaved (or 34 people are enslaved for every 10,000 people)
- 0.44 million (69%) are in labor exploitation
- 0.16 million (25%)(or 36% of labor exploitation) are in construction*
- 0.01 million (2%)(or 2% of labor exploitation) are in agriculture*
- 0.27 million (42%)(or 62% of labor exploitation) are in domestic work
- 0.10 million (16%) are in sexual exploitation
- 0.10 million (16%) are in state imposed forced labor
Modern-day slavery generates $150 billion in profits every year
- $51.8 billion (34%) of profits are generated in Asia/Pacific every year / $5,000 per victim
- $20.1 billion (39%) are from labor exploitation / $2,500 per victim
- $13.4 billion (26%)(or 67% of labor exploitation) are from construction* / $2,700 per victim
- $0.4 billion (1%)(or 2% of labor exploitation) are from agriculture* / $400 per victim
- $6.3 billion (12%)(or 31% of labor exploitation) are from domestic work / $3,300 per victim
- $31.7 billion (61%) are from sexual exploitation / $12,000 per victim
- $20.1 billion (39%) are from labor exploitation / $2,500 per victim
- $13.1 billion (9%) of profits are generated in Africa every year / $3,900 per victim
- $4.2 billion (32%) are from labor exploitation / $1,700 per victim
- $2.8 billion (21%)(or 67% of labor exploitation) are from construction* / $3,300 per victim
- $1.1 billion (9%)(or 26% of labor exploitation) are from agriculture* / $1,000 per victim
- $0.3 billion (2%)(or 7% of labor exploitation) are from domestic work / $600 per victim
- $8.9 billion (68%) are from sexual exploitation / $11,000 per victim
- $4.2 billion (32%) are from labor exploitation / $1,700 per victim
- $12.0 billion (8%) of profits are generated in Latin America and the Caribbean every year / $7,500 per victim
- $1.5 billion (13%) are from labor exploitation / $1,300 per victim
- $0.8 billion (7%)(or 53% of labor exploitation) are from construction* / $4,100 per victim
- $0.2 billion (2%)(or 13% of labor exploitation) are from agriculture* / $700 per victim
- $0.5 billion (4%)(or 33% of labor exploitation) are from domestic work / $800 per victim
- $10.4 billion (87%) are from sexual exploitation / $27,000 per victim
- $1.5 billion (13%) are from labor exploitation / $1,300 per victim
- $18.0 billion (12%) of profits are generated in CSEE & CIS every year / $12,900 per victim
- $3.8 billion (21%) are from labor exploitation / $3,619 per victim
- $3.0 billion (16.5%)(or 79% of labor exploitation) are from construction* / $5,400 per victim
- $0.7 billion (4%)(or 18% of labor exploitation) are from agriculture* / $1,400 per victim
- $0.1 billion (0.5%)(or 3% of labor exploitation) are from domestic work / $1,700 per victim
- $14.3 billion (79%) are from sexual exploitation / $42,000 per victim
- $3.8 billion (21%) are from labor exploitation / $3,619 per victim
- $46.9 billion (31%) of profits are generated in Developed Economies and the EU every year / $34,800 per victim
- $20.6 billion (44%) are from labor exploitation / $20,196 per victim
- $14.0 billion (30%)(or 68% of labor exploitation) are from construction* / $30,400 per victim
- $6.4 billion (13.5%)(or 31% of labor exploitation) are from agriculture* / $12,200 per victim
- $0.2 billion (0.5%)(or 1% of labor exploitation) are from domestic work / $7,500 per victim
- $26.2 billion (56%) are from sexual exploitation / $80,000 per victim
- $20.6 billion (44%) are from labor exploitation / $20,196 per victim
- $8.5 billion (6%) of profits are generated in the Middle East every year / $15,000 per victim
- $1.02 billion (12.0%) are from labor exploitation / $2,318 per victim
- $0.60 billion (7.0%)(or 59% of labor exploitation) are from construction* / $3,600 per victim
- $0.02 billion (0.2%)(or 2% of labor exploitation) are from agriculture* / $2,900 per victim
- $0.40 billion (4.7%)(or 39% of labor exploitation) are from domestic work / $1,400 per victim
- $7.50 billion (88.0%) are from sexual exploitation / $55,000 per victim
- $1.02 billion (12.0%) are from labor exploitation / $2,318 per victim
Modern-day slavery in the U.S.
In 1865, the 13th Amendment was ratified, stating:
“Neither slavery nor involuntary servitude, except as a punishment for crime whereof the party shall have been duly convicted, shall exist within the United States, or any place subject to their jurisdiction.”
Sadly, the 13th Amendment did not mark the ending of slavery in the United States.
- The U.S. currently has approximately 60,000 slaves.
- There are 14,500 to 17,500 people trafficked into the United States each year.
- There are documented cases of slavery and human trafficking in at least 90 American cities.
13 types of laws that states are enacting to fight modern-day slavery:
- Sex Trafficking [ST]: Criminalizes sex trafficking.
- Labor Trafficking [LT]: Criminalizes labor trafficking.
- Asset Forfeiture [AF]: Requires that those guilty of human trafficking forfeit their assets.
- Investigative Tools [IT]: Allows police to wiretap in human trafficking cases or extends racketeering laws to include human trafficking.
- Police Training [PT]: Mandates law enforcement to be trained in human trafficking issues and laws.
- Task Force [TF]: Establishes a task force dedicated to addressing human trafficking.
- Easier Prosecution [EP]: Ensures that force, fraud, or coercion are not required to prosecuted someone for sex trafficking of a minor.
- Trafficking Hotline [TH]: Mandates or encourages the public posting of a human trafficking hotline.
- Victim Assistance [VA]: Provides assistance or funds programs to help victims of human trafficking.
- Child Welfare [CW]: Provides child welfare services to victims of sex trafficking under the age of 18.
- Prosecution Immunity [PI]: Grants immunity from prosecution to victims of sex trafficking under the age of 18 .
- Civil Damages [CD]: Permits victims of human trafficking to seek civil damages from their traffickers.
- Conviction Removal [CR]: Permits victims of sex trafficking to have prostitution convictions removed from their criminal records.
| STATE | SCORE | ST | LT | AF | IT | PT | TF | EP | TH | VA | CW | PI | CD | CR |
|---|---|---|---|---|---|---|---|---|---|---|---|---|---|---|
| Delaware | 13 | ✓ | ✓ | ✓ | ✓ | ✓ | ✓ | ✓ | ✓ | ✓ | ✓ | ✓ | ✓ | ✓ |
| New Jersey | 13 | ✓ | ✓ | ✓ | ✓ | ✓ | ✓ | ✓ | ✓ | ✓ | ✓ | ✓ | ✓ | ✓ |
| Washington | 13 | ✓ | ✓ | ✓ | ✓ | ✓ | ✓ | ✓ | ✓ | ✓ | ✓ | ✓ | ✓ | ✓ |
| Connecticut | 12 | ✓ | ✓ | ✓ | ✓ | ✓ | ✓ | ✓ | ✓ | ✓ | ✓ | ✓ | ✓ | |
| Mississippi | 11 | ✓ | ✓ | ✓ | ✓ | ✓ | ✓ | ✓ | ✓ | ✓ | ✓ | ✓ | ||
| Arkansas | 11 | ✓ | ✓ | ✓ | ✓ | ✓ | ✓ | ✓ | ✓ | ✓ | ✓ | ✓ | ||
| Florida | 11 | ✓ | ✓ | ✓ | ✓ | ✓ | ✓ | ✓ | ✓ | ✓ | ✓ | ✓ | ||
| Massachusetts | 11 | ✓ | ✓ | ✓ | ✓ | ✓ | ✓ | ✓ | ✓ | ✓ | ✓ | ✓ | ||
| Minnesota | 11 | ✓ | ✓ | ✓ | ✓ | ✓ | ✓ | ✓ | ✓ | ✓ | ✓ | ✓ | ||
| North Carolina | 11 | ✓ | ✓ | ✓ | ✓ | ✓ | ✓ | ✓ | ✓ | ✓ | ✓ | ✓ | ||
| Texas | 10 | ✓ | ✓ | ✓ | ✓ | ✓ | ✓ | ✓ | ✓ | ✓ | ✓ | |||
| Louisiana | 10 | ✓ | ✓ | ✓ | ✓ | ✓ | ✓ | ✓ | ✓ | ✓ | ✓ | |||
| Kentucky | 10 | ✓ | ✓ | ✓ | ✓ | ✓ | ✓ | ✓ | ✓ | ✓ | ✓ | |||
| Ohio | 10 | ✓ | ✓ | ✓ | ✓ | ✓ | ✓ | ✓ | ✓ | ✓ | ✓ | |||
| Kansas | 10 | ✓ | ✓ | ✓ | ✓ | ✓ | ✓ | ✓ | ✓ | ✓ | ✓ | |||
| Tennessee | 10 | ✓ | ✓ | ✓ | ✓ | ✓ | ✓ | ✓ | ✓ | ✓ | ✓ | |||
| Illinois | 10 | ✓ | ✓ | ✓ | ✓ | ✓ | ✓ | ✓ | ✓ | ✓ | ✓ | |||
| Nebraska | 10 | ✓ | ✓ | ✓ | ✓ | ✓ | ✓ | ✓ | ✓ | ✓ | ✓ | |||
| Vermont | 10 | ✓ | ✓ | ✓ | ✓ | ✓ | ✓ | ✓ | ✓ | ✓ | ✓ | |||
| California | 9 | ✓ | ✓ | ✓ | ✓ | ✓ | ✓ | ✓ | ✓ | ✓ | ||||
| Hawaii | 9 | ✓ | ✓ | ✓ | ✓ | ✓ | ✓ | ✓ | ✓ | ✓ | ||||
| Nevada | 9 | ✓ | ✓ | ✓ | ✓ | ✓ | ✓ | ✓ | ✓ | ✓ | ||||
| Pennsylvania | 9 | ✓ | ✓ | ✓ | ✓ | ✓ | ✓ | ✓ | ✓ | ✓ | ||||
| South Carolina | 9 | ✓ | ✓ | ✓ | ✓ | ✓ | ✓ | ✓ | ✓ | ✓ | ||||
| Utah | 9 | ✓ | ✓ | ✓ | ✓ | ✓ | ✓ | ✓ | ✓ | ✓ | ||||
| Oklahoma | 8 | ✓ | ✓ | ✓ | ✓ | ✓ | ✓ | ✓ | ✓ | |||||
| Colorado | 8 | ✓ | ✓ | ✓ | ✓ | ✓ | ✓ | ✓ | ✓ | |||||
| Georgia | 8 | ✓ | ✓ | ✓ | ✓ | ✓ | ✓ | ✓ | ✓ | |||||
| New Mexico | 8 | ✓ | ✓ | ✓ | ✓ | ✓ | ✓ | ✓ | ✓ | |||||
| Alabama | 8 | ✓ | ✓ | ✓ | ✓ | ✓ | ✓ | ✓ | ✓ | |||||
| Indiana | 8 | ✓ | ✓ | ✓ | ✓ | ✓ | ✓ | ✓ | ✓ | |||||
| Oregon | 8 | ✓ | ✓ | ✓ | ✓ | ✓ | ✓ | ✓ | ✓ | |||||
| New Hampshire | 8 | ✓ | ✓ | ✓ | ✓ | ✓ | ✓ | ✓ | ✓ | |||||
| New York | 8 | ✓ | ✓ | ✓ | ✓ | ✓ | ✓ | ✓ | ✓ | |||||
| Iowa | 7 | ✓ | ✓ | ✓ | ✓ | ✓ | ✓ | ✓ | ||||||
| Maryland | 7 | ✓ | ✓ | ✓ | ✓ | ✓ | ✓ | ✓ | ||||||
| Missouri | 7 | ✓ | ✓ | ✓ | ✓ | ✓ | ✓ | ✓ | ||||||
| Virginia | 7 | ✓ | ✓ | ✓ | ✓ | ✓ | ✓ | ✓ | ||||||
| Wisconsin | 7 | ✓ | ✓ | ✓ | ✓ | ✓ | ✓ | ✓ | ||||||
| Wyoming | 6 | ✓ | ✓ | ✓ | ✓ | ✓ | ✓ | |||||||
| Alaska | 6 | ✓ | ✓ | ✓ | ✓ | ✓ | ✓ | |||||||
| D.C. | 6 | ✓ | ✓ | ✓ | ✓ | ✓ | ✓ | |||||||
| Idaho | 6 | ✓ | ✓ | ✓ | ✓ | ✓ | ✓ | |||||||
| Michigan | 6 | ✓ | ✓ | ✓ | ✓ | ✓ | ✓ | |||||||
| West Virginia | 5 | ✓ | ✓ | ✓ | ✓ | ✓ | ||||||||
| Arizona | 5 | ✓ | ✓ | ✓ | ✓ | ✓ | ||||||||
| Maine | 5 | ✓ | ✓ | ✓ | ✓ | ✓ | ||||||||
| Montana | 5 | ✓ | ✓ | ✓ | ✓ | ✓ | ||||||||
| Rhode Island | 5 | ✓ | ✓ | ✓ | ✓ | ✓ | ||||||||
| North Dakota | 4 | ✓ | ✓ | ✓ | ✓ | |||||||||
| South Dakota | 4 | ✓ | ✓ | ✓ | ✓ |
Do slaves work for you?
Much of the money you spend on consumer products could be used to support slavery.
Free2Work grades consumer brands based on how well they safeguard against modern-day slavery. Here’s what they look at:
- Policies: They evaluate the brand’s code of conduct, sourcing and subcontracting policies, and the brand’s involvement with other slave-free organizations.
- Transparency & Traceability: They determine if the brand thoroughly understands its own supply chain and if it discloses critical information to the public.
- Monitoring & Training: They measure the adequacy of the brand’s monitoring program to address the specific issues of child and forced labor.
- Worker Rights: They assess if the brand seeks to actively support worker well-being and rights such as organizing and earning a living wage.
Do slaves help dress you?
Clothing and shoes pass through many hands as it goes from raw material to finished product. Along the way, there is a high risk of forced labor. In 2012, Forever 21 was subpoenaed by the U.S. Labor department for having “sweatshop-like conditions” at their L.A. manufacturing facility. Cotton is harvested in at least 15 supplier countries by children or forced labor. In Uzbekistan up to 2 million children are withdrawn from school to go work in the fields.
Free2Work Scorecards for Notable Companies:
- A: BVD, Russell Athletic, Bike, Brooks, Jerzees, Fruit of the Loom, Spalding, Vanity Fair, Zara, Leggs, Playtex, Hanes, Champion, Wonderbra, Timberland
- B: Reebok, Adidas, Patagonia, H&M, Stussy, Mossimo, Jockey, Nike, New Balance, Banana Republic, Gap, Old Navy, Puma, Levi Strauss, Dockers, American Eagle
- C: Lee Sport, Wrangler, Jansport, Lee Jeans, Vans, Nautica, The North Face, Disney, Lululemon, Tommy Hilfiger, Calvin Klein, G.H. Bass, Van Heusen, IZOD
- D: Coles, Hollister, Abercrombie & Fitch, Quicksilver, Walmart, DC, Express, Aeropostale, Forever 21, Carters, OshKosh B’Gosh, ROXY
- F: Lacoste, Ecko, Sketchers, Katies, City Chic
Do slaves feed you chocolate?
70 to 75% of the world’s cocoa beans are grown on small farms in West Africa. In 2011, 1.8 million children were working in the cocoa industry in the Ivory Coast. Most work 80-100 hours and are unpaid.
Free2Work Scorecards for Notable Companies:
- A: Devine Chocolate, Sweat Earth Chocolate
- B: Frontier Fair-trade, Alter Eco
- C: Jelly Belly, Ghiradeli
- D: Hershey’s, Cadbury, Pop Secret, Disney Candy, Godiva, Mars, Dove, Snickers, M&M’s, See’s Candies, Reese’s, PayDay, Milk Duds, Heath, Almond Joy, Kit Kat, Nesquik, Butterfinger, Abeulita, Twix, 3 Musketeers, Emerald Nuts, Kettle Brand Chips
- F: Personal Creations, Red Envelop, Behr’s Chocolates
Do slaves entertain you?
Many electronics use metals that can be linked to child and forced labor. In places, like Democratic Republic of Congo, armed guards force miners to work while profits go to fuel armed conflict.
Free2Work Scorecards for Notable Companies:
- A: none
- B: Microsoft, Apple, Nokia, Samsung, LG Electronics, Sanyo, Panasonic, Intel, Acer, Toshiba, Dell, Hewlett-Packard, Motorola Mobility, Alienware
- C: Phillips, Hitachi, AWA, Garmin, Sony, SanDisk, Sharp, IBM, Blackberry
- D: Amazon Kindle, HTC Electronics, Nintendo, Oracle, Canon, LeapFrog, LeapPad, Fujitsu
- F: Palsonic, Hisense
Do slaves make your coffee?
Coffee is the second most traded commodity in the world, behind oil. Yet, half of the coffee harvesters in the world do not even make minimum wage.
Free2Work Scorecards for Notable Companies:
- A: Starbucks (Fair Trade), Newman’s Own (Fair Trade), Green Mountain Coffee (Fair Trade)
- B: Illy, Peet’s Coffee & Tea (UTZ), Dunkin’ Donuts (Fair Trade), Baskin Robins (Fair Trade), Seattle’s Best (Fair Trade), Caribou Coffee (Rainforest Alliance), Starbucks
- C: Stumptown Coffee, 365 Everyday Value (Whole Trade), Tully’s Coffee, Green Mountain Coffee, Newman’s Own, Caribou Coffee, San Francisco Bay Coffee
- D: Nescafe, Dunkin’ Donuts, Baskin Robins,
- F: Seattle’s Best, 365 Everyday Value, Peet’s Coffee & Tea
5 Things You Can Do to Stop Modern-Day Slavery
Modern-day slavery is a market driven criminal industry that is built on the principles of supply and demand. It is fueled by a demand for cheap labor, cheap services, and commercial sex acts. If we want to solve the problem of human trafficking, we must address the low risk and the high profits of the industry.
- Be a conscientious consumer. Research products that you buy to ensure they are slave free.
- Pressure your local, state, and national law makers to create laws that fight human trafficking. Contact them and ask them what they are doing in this arena.
- Send money to organizations like International Justice Mission who spend an exhaustive amount of time and energy fighting policies in other countries to prohibit human trafficking and forced labor.
- Volunteer to do victim outreach at a local anti-trafficking organization.
- Host awareness events for your family, friends, and community that help people learn ways they can help end modern-day slavery.
*construction includes manufacturing, mining, and utilities.
*agriculture includes forestry and fishing.
Region definitions:
Asia-Pacific:
- South Asia: Afghanistan | Bangladesh | Bhutan | India | Maldives | Nepal | Pakistan | Sri Lanka
- South-East Asia: Brunei | Darussalam | Cambodia | East Timor | Indonesia | Lao People’s Democratic Republic | Malaysia | Myanmar | Philippines | Singapore | Thailand | Viet Nam
- Pacific Islands: Fiji | Papua New Guinea | Solomon Islands
- East Asia: China | Hong Kong, China | Democratic People’s Republic of Korea | Republic of Korea | Macau, China | Mongolia | Taiwan, China
Africa:
- North Africa: Algeria | Egypt | Libyan Arab Jamahiriya | Morocco | Sudan | Tunisia
- Eastern Africa: Burundi | Comoros | Eritrea | Ethiopia | Kenya | Madagascar | Malawi | Mauritius | Mozambique | Réunion | Rwanda | Somalia | United Republic of Tanzania | Uganda | Zambia | Zimbabwe
- Middle Africa: Angola | Cameroon | Central African Republic | Chad | Congo | Democratic Republic of Congo | Equatorial Guinea | Gabon
- Southern Africa: Botswana | Lesotho | Namibia | South Africa | Swaziland
- Western Africa: Benin | Burkina Faso | Cape Verde | Côte d’Ivoire | Gambia | Ghana | Guinea | Guinea-Bissau | Liberia | Mali | Mauritania | Niger | Nigeria | Senegal | Sierra Leone | Togo
Latin America & the Caribbean:
- Caribbean: Bahamas | Barbados | Cuba | Dominican Republic | Guadeloupe | Guyana | Haiti | Jamaica | Martinique | Netherlands Antilles | Puerto Rico | Suriname | Trinidad and Tobago
- Central America: Belize | Costa Rica | El Salvador | Guatemala | Honduras | Mexico | Nicaragua | Panama
- South America: Argentina | Bolivia | Brazil | Chile | Colombia | Ecuador | Paraguay | Peru | Uruguay | Bolivarian Republic of Venezuela
Central & South-Eastern Europe (non- EU) & CIS:
- Central & South-Eastern Europe: Albania | Bosnia and Herzegovina | Croatia | Serbia and Montenegro | The former Yugoslav Republic of Macedonia | Turkey
- Commonwealth of Independent States: Armenia | Azerbaijan | Belarus | Georgia | Kazakhstan | Kyrgyzstan | Republic of Moldova | Russian Federation | Tajikistan | Turkmenistan | Ukraine | Uzbekistan
Developed Economies & European Union:
- European Union: Austria | Belgium | Bulgaria |Cyprus | Czech Republic | Denmark | Estonia | Finland | France | Germany | Greece | Hungary | Ireland | Italy | Latvia | Lithuania | Luxembourg | Malta | Netherlands | Poland | Portugal | Romania | Slovakia | Slovenia | Spain | Sweden | United Kingdom
- North America: Canada | United States
- Other Developed Economies: Australia | Israel | Japan | New Zealand
- Western Europe (non- EU): Iceland | Norway | Switzerland
Middle East:
- Bahrain | Islamic Republic of Iran | Iraq | Jordan | Kuwait | Lebanon | Oman | Qatar | Saudi Arabia | Syrian Arab Republic | United Arab Emirates | Occupied Palestinian Territory | Yemen
Sources:
- http://www.ilo.org/wcmsp5/groups/public/—ed_norm/—declaration/documents/publication/wcms_243391.pdf
- http://www.ilo.org/wcmsp5/groups/public/—ed_norm/—declaration/documents/publication/wcms_182004.pdf
- http://www.ohchr.org/documents/publications/slaveryen.pdf
- http://www.globalslaveryindex.org/findings/
- http://www.ilo.org/global/topics/forced-labour/lang–en/index.htm
- https://www.freetheslaves.net/
- http://www.polarisproject.org/what-we-do/policy-advocacy/national-policy/state-ratings-on-human-trafficking-laws
- http://www.huffingtonpost.com/2012/10/26/forever-21-sweatshop-investigation_n_2025390.html
- http://www.businessweek.com/magazine/content/11_05/b4213090559511.htm
- http://thecnnfreedomproject.blogs.cnn.com/2012/01/19/child-slavery-and-chocolate-all-too-easy-to-find/
- http://www.bloomberg.com/news/2014-03-18/hershey-judge-says-shareholders-can-seek-child-labor-files-1-.html
- http://www.free2work.org/
- http://slaveryfootprint.org
- http://www.examiner.com/article/how-many-slaves-work-for-you
- http://www.state.gov/j/tip/id/help/index.htm
- http://ngm.nationalgeographic.com/ngm/0309/feature1/online_extra.html